I’ve recently been invited (and accepted) to join the Program Committee for the Visual Interfaces to the Social and the Semantic Web workshop which will be held as a part of the 2009 International Conference on Intelligent User Interfaces which takes place in February in Florida. Here’s a brief description of the workshop:
This workshop aims to bring together researchers and practitioners from different fields, such as Human-Computer Interaction, Information Visualization, Semantic Web, and Personal Information Management, to discuss latest research results and challenges in designing, implementing, and evaluating intelligent interfaces supporting access, navigation and publishing of different types of contents on the Social and Semantic Web. In addition, the workshop also serves as an opportunity for researchers to gain feedback on their work as well as to identify potential collaborations with their peers
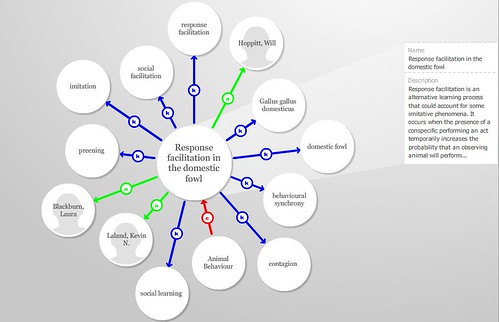
I’m quite excited about this workshop, I’ve been spending some of 10% time at work on playing with ideas around how to visualise data on the Semantic Web just over eighteen months ago I was already using and extending Moritz Stefaner‘s excellent Relation Browser to visualise semantically structured data, and was effectively walking around entire graphs of data:
However there were problems with this approach, performance over large sets of data was one, and I spent a considerable amount of time extending the tool. However it occurred to me that with Relation Browser and other similar tools you are forced to take a very node centric view, when sometimes whats more useful is to be able to take a graph or named graph centric view – its not only important to be able to center on one node and see it’s direct relationships it’s often just as important to understand where that node sits with a much wider context. To that end I’ve been experimenting with visualisations that allow you to not only center on a particular node and ‘follow your nose’ but to also pan out take a more hollistic view of that graph of data – I’ve also been thinking about ways to visualise the provenance of data.
I wish I had known about this workshop sooner, it might have been the kick I needed to actually finish demonstrators of these ideas, I think I might still have time though …
With reference to the workshop itself though here’s some important dates and other bits of information if you’re interested in submitting a paper:
- Paper submission deadline: 14th November, 2008
- Notication of acceptance: 7th December, 2008
- Camera-ready paper submission deadline: 14th December, 2008
- Full papers which should be between 6 and 10 pages.
- Short papers and position papers which should be up to 5 pages.
- Demo papers – 2 page description with a screenshot of the working prototype or preferrably a link to an online demo.
- Submissions must be in PDF format and prepared according to the IUI format.
It promises to be an excellent conference, and one that I will definitely be attending.


